The descriptions below explain how each of our vehicle tests is conducted and how the results translate into ratings.
IIHS currently maintains ratings in three crashworthiness evaluations — the moderate overlap front, small overlap front and side tests. We also evaluate headlight systems and test front crash prevention systems for their ability to avoid other vehicles and pedestrians. In addition, we rate seat belt reminders and the child seat attachment hardware known as LATCH.
Although we are not currently rating vehicles for roof strength or head restraints, you can still find those ratings for older models on our website.
For crash tests that we conduct at our facility, we purchase the vehicles from dealers just like an ordinary consumer. If the test is being conducted at the manufacturer's request and isn't part of our regular testing schedule, then the manufacturer reimburses us for the vehicle.
A frontal crash is the most common type of crash resulting in fatalities. Major strides have been made in frontal protection, thanks in large part to the crash test program that the National Highway Traffic Safety Administration (NHTSA) began in the late 1970s and the crashworthiness evaluations that IIHS began in 1995.
IIHS conducts three different frontal crash tests: the moderate overlap front test (formerly known as the frontal offset test), driver-side small overlap front test and passenger-side small overlap front test. Beginning with 2024, the latter two tests are combined into a single small overlap rating.
Moderate overlap front test configurationDriver-side small overlap front test configurationPassenger-side small overlap front test configuration
Moderate overlap front test
When we began our moderate overlap front tests, the majority of vehicles were rated poor or marginal. Today, all vehicles earn good ratings in that original evaluation. Occupant compartments are much stronger than they used to be. They hold up in a crash and allow safety belts and airbags to do their jobs to protect the driver. However, not all the advancements that have made front seat occupants safer have been applied in the back seat.
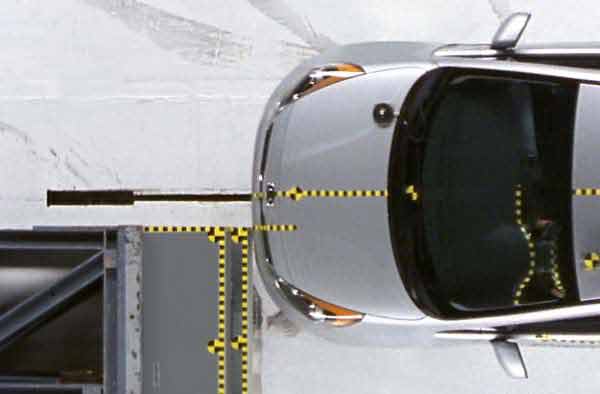
In the moderate overlap front test, a vehicle travels at 40 mph toward a barrier with a deformable face made of aluminum honeycomb. Forty percent of the total width of the vehicle strikes the barrier on the driver side.
The forces in the test are similar to those that would result from a frontal offset crash between two vehicles of the same weight, each going just under 40 mph.
In the original version of the test, only one dummy — a Hybrid III dummy representing an average-size man and positioned in the driver seat — was used.
In 2022, we updated the test to address lagging protection for rear occupants. Now, a second, smaller Hybrid III dummy has been added. The second dummy, whose size represents a small woman or an average 12-year-old, is positioned in the second-row seat behind the driver. The updated evaluation incorporates new metrics that focus on the injuries most frequently seen in rear-seat occupants.
Driver-side small overlap front test
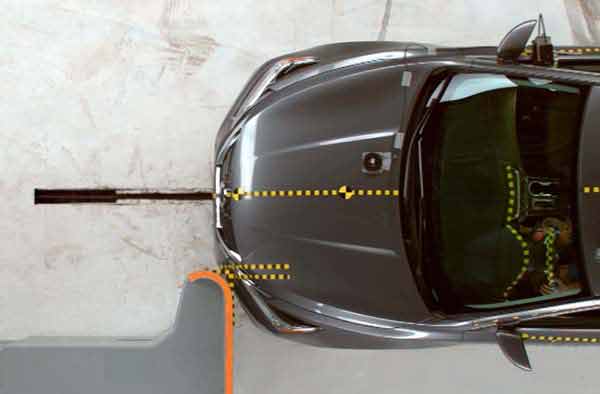
The Institute introduced the driver-side small overlap front crash test in 2012. The test is designed to replicate what happens when the front left corner of a vehicle collides with another vehicle or an object like a tree or utility pole. This crash test is a challenge for some safety belt and airbag designs because occupants move both forward and toward the side of the vehicle.
In the driver-side small overlap front test, a vehicle travels at 40 mph toward a rigid barrier. A Hybrid III dummy representing an average-size man is positioned in the driver seat. Twenty-five percent of the total width of the vehicle strikes the barrier on the driver side.
Most modern cars have safety cages encapsulating the occupant compartment and built to withstand head-on collisions and moderate overlap frontal crashes with little deformation. At the same time, crush zones help manage crash energy to reduce forces on the occupant compartment. The main crush-zone structures are concentrated in the middle 50% of the front end. When a crash involves these structures, the occupant compartment is protected from intrusion, and front airbags and safety belts can effectively restrain and protect occupants.
Small overlap frontal crashes primarily affect a vehicle’s outer edges, which aren't well protected by the crush-zone structures. Crash forces go directly into the front wheel, suspension system and firewall. It is not uncommon for the wheel to be forced rearward into the footwell, contributing to even more intrusion in the occupant compartment and resulting in serious leg and foot injuries. To provide effective protection in small overlap crashes, the safety cage needs to resist crash forces that aren't tempered by crush-zone structures. Widening these front-end structures also helps.
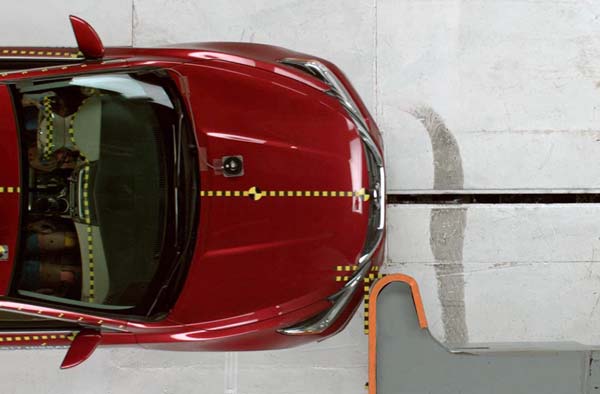
Passenger-side small overlap front test
Manufacturers responded to the driver-side small overlap front test by improving vehicle structures and airbags, and most vehicles soon began to earn good ratings. However, IIHS research tests demonstrated that those improvements didn't always carry over to the passenger side. Discrepancies between the left and right sides of vehicles spurred us to develop a passenger-side small overlap front test and begin issuing passenger-side ratings in 2017.
The passenger-side test is the same as the driver-side test except the vehicle overlaps the barrier on the right side. In addition, instead of just one Hybrid III dummy, there are two — one in the driver seat and one in the passenger seat. Most vehicles today earn good ratings in the passenger-side evaluation as well.
Ratings criteria
Engineers consider three factors to determine how a vehicle rates in the moderate overlap and small overlap front tests: structural performance, injury measures and dummy movement.
Structure/safety cage: To assess a vehicle's structural performance, engineers measure the amount of intrusion into the occupant compartment at key locations in the interior and exterior of the vehicle after the crash. The amount and pattern of intrusion shows how well the front-end crush zone managed the crash energy and how well the safety cage held up.
Injury measures: Sensors in the dummies are used to determine the likelihood that a driver or passenger would sustain various types of injuries in a similar real-world crash. Measures recorded by sensors in the head, neck, chest, legs and feet of the dummy indicate the level of stress or strain on that part of the body — in other words, the risk of injury. In the updated moderate overlap front test, a pressure sensor that monitors the position of the shoulder belt on the torso of the rear dummy also helps gauge the risk of chest injuries.
Restraints/dummy movement: Even if injury measures are low, it's important to consider the movement of the dummy or dummies during the crash, since not all occupants are the same size as the dummies or seated exactly the same way. A close call for a dummy could be an actual injury for a person.
Before each crash test, technicians put greasepaint on the dummy's head, knees and lower legs. After the test, the paint shows what parts of the vehicle came into contact with those parts of the dummy. The paint, combined with high-speed film footage of the crash, allows engineers to evaluate the movement of the dummy or dummies.
Understanding the ratings
How do vehicles that earn good ratings in the IIHS frontal crash tests perform in similar real-world crashes? An analysis of 14 years' worth of crash data involving IIHS-rated vehicles shows that a driver of a model rated good in the original moderate overlap test is 46% less likely to die in a head-on crash with a similar vehicle, compared with a driver of a model rated poor. A separate analysis shows that a driver of a vehicle rated good in the driver-side small overlap front test is 12% less likely to be killed in any type of frontal crash than a driver of a vehicle with a poor rating.
Frontal crash test results can't be used to compare vehicle performance across weight classes. That's because the kinetic energy involved in the moderate overlap and small overlap front tests depends on the speed and weight of the test vehicle. Thus, the crash is more severe for heavier vehicles. Given equivalent frontal ratings, the heavier of two vehicles usually offers better protection in real-world crashes.
How do the Institute's frontal crash tests differ from NHTSA's New Car Assessment Program frontal test?
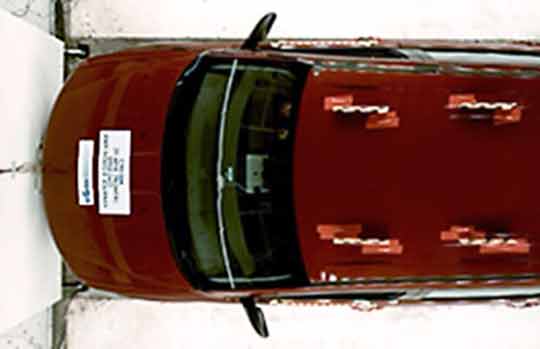
In the New Car Assessment Program (NCAP), passenger vehicles are crashed at 35 mph into a rigid barrier that covers the full width of the vehicle.
The Institute runs offset frontal tests instead of full-width frontal tests. In an offset crash only one side of a vehicle's front end, not the full width, hits the barrier. As a result, a smaller part of the structure has to manage the crash energy, and intrusion into the occupant compartment is more likely. An offset test is more demanding of a vehicle's structure than a full-width test, while a full-width test is more demanding of safety belts and airbags. In a full-width test, there is less crushing of the vehicle structure so the decelerations that these restraints must handle are greater. Together, the tests provide a more complete picture of frontal crashworthiness than either test by itself.
NHTSA's full-width frontal test configuration
NCAP has been extremely successful. Automakers responded by improving their vehicles to earn good ratings, giving them a higher level of frontal crashworthiness than is required by law. By the 1990s, most vehicles were performing well in the full-width frontal test.
In 2010, NHTSA announced an enhanced 5-star rating system that toughened criteria and combined ratings from its different tests into a single rating to provide consumers an overall view of vehicle safety. The NCAP changes apply to 2011 and later models.
Side crash tests 2003-present
Side crashes account for about a quarter of passenger vehicle occupant deaths in the United States. Protecting people in side crashes is challenging because the sides of vehicles have relatively little space to absorb energy and shield occupants, unlike the fronts and rears, which have substantial crush zones. Automakers have made big strides in side protection by installing side airbags and strengthening the structures of vehicles. The Institute's testing program has played a key role in bringing about these improvements. However, some vehicles cope better than others with more severe side crashes, indicating that there is still room for more progress.
Side airbags, which today are standard on most new passenger vehicles, are designed to keep people from colliding with the inside of the vehicle and with objects outside the vehicle in a side crash. They also help by spreading impact forces over a larger area of an occupant's body. However, side airbags by themselves are not enough. Strong structures that work well with the airbags also are crucial.
Need for side testing
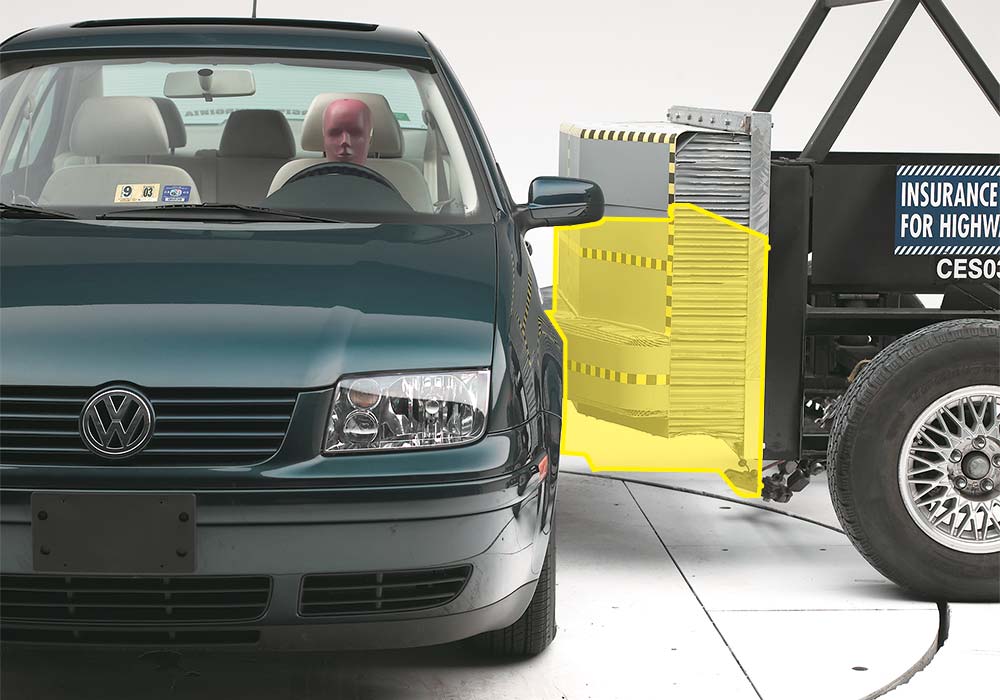
IIHS began its original side test program in 2003. At that point, the federal government was already performing side tests on new passenger vehicles as part of the New Car Assessment Program. But we were concerned that the government's test didn't completely capture the types of crashes likely to occur in the real world.
That's because the moving barrier used in the government's test was developed in the early 1980s, when most of the vehicles on the road were cars, before SUVs and pickups became as prevalent as they are today. The height of the barrier's front end is below the heads of the crash test dummies. As a result, the federal test doesn't assess the much greater risk of head injury from impacts with taller vehicles. To fill this gap, we initiated our own test with a different barrier — one with the height and shape of the front end of a typical SUV or pickup at the time.
NHTSA barrier, shown in yellow, superimposed over the taller barrier used in the original IIHS test
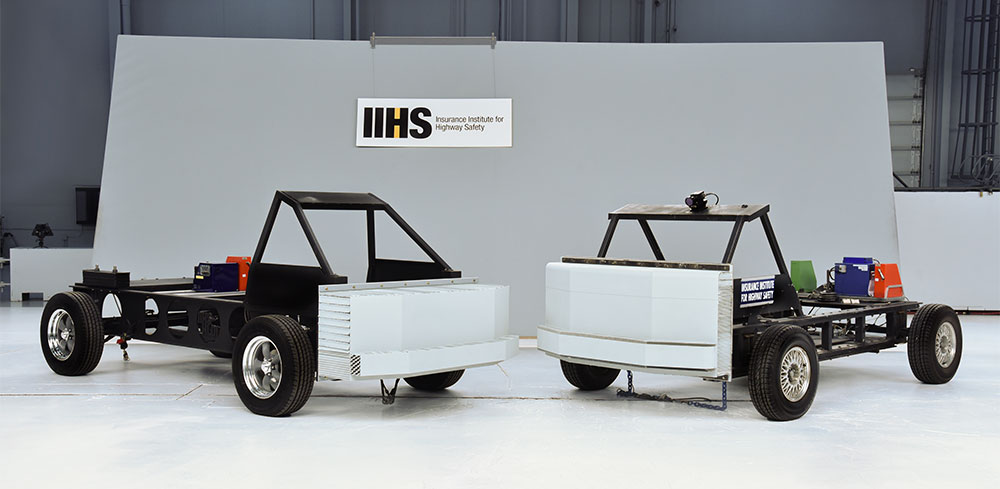
In 2021, IIHS revamped its test with a more severe crash and a more realistic striking barrier. The new barrier is closer to the weight of today's SUVs, and the damage pattern it creates mimics the damage a striking SUV would cause more accurately than the old barrier. It is closer to the ground and shorter than the original IIHS barrier but still higher than the NHTSA barrier.
Updated (left) and original IIHS side test barriers
How the test works
In our original test, a 3,300-pound barrier with the approximate height of an SUV hit the driver side of the vehicle at 31 mph. The new test is conducted at 37 mph and uses a 4,200-pound barrier, which is more representative of vehicles that are common on the road today. As a result of these changes, the new test involves 82% more energy than the original test.
The honeycomb surface of the barrier in the second test is also different. Like real SUVs and pickups, the new barrier tends to bend around the B-pillar between the driver and rear passenger doors. This creates depressions in the front and rear doors of the struck vehicle. The occupant space can be compromised this way even if the vehicle has a strong B-pillar.
In both tests, two SID-IIs dummies representing small (5th percentile) women or 12-year-old children are positioned in the driver seat and the rear seat behind the driver.
IIHS was the first in the United States to use this smaller dummy in a test for consumer information. It was chosen because women are more likely than men to suffer serious head injuries in real-world side impacts. Shorter drivers have a greater chance of having their heads come into contact with the front end of the striking vehicle in a left-side crash.
Ratings criteria
Engineers look at three factors to determine side ratings: driver and passenger injury measures, head protection and structural performance.
Injury measures: Injury measures from the two dummies are used to determine the likelihood that occupants would sustain significant injuries in a real-world crash. In the original test, measures are recorded from the head, neck, chest, abdomen, pelvis and femur. The updated test uses measures from all the same sensors except the femur, which doesn't provide reliable data in the more severe impact. In both tests, these injury measures, especially the ones from the head and upper body, are major components of each vehicle's overall side rating.
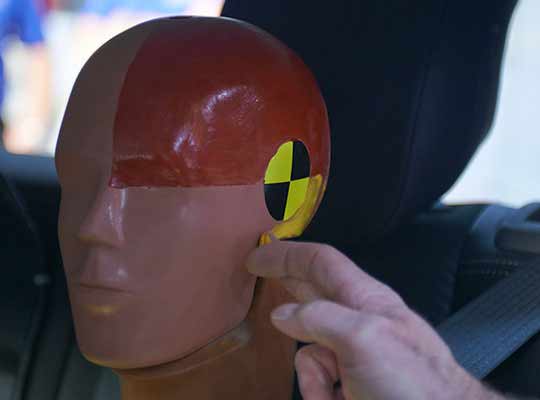
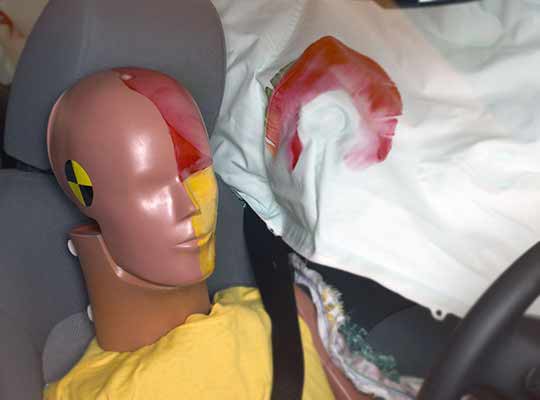
Head protection: To supplement head injury measures, technicians put greasepaint on the dummies' heads before each crash test. After the test, the paint shows what parts of the vehicle or the barrier came into contact with the heads. If the vehicle has airbags and they perform correctly, the paint should end up on them.
A technician applies greasepaint before a crash test.Smeared greasepaint shows where the driver dummy's head hit the side curtain airbag.
In cases in which the barrier hits a dummy's head during impact, the dummy usually records very high injury measures. That might not be true, however, with a "near miss" or a grazing contact. The paint, along with footage of the test recorded on high-speed film, helps identify such cases, which is important because small differences in occupants' heights or seating positions compared with those of the test dummies could result in a hard contact and high risk of serious head injury.
Structure/safety cage: Engineers assess the vehicle's structural performance by measuring the amount of intrusion into the occupant compartment around the B-pillar (between the doors). Some intrusion into the occupant compartment is inevitable in serious side impacts, but it shouldn't seriously compromise the driver and passenger space. As with head protection, this is another assessment that helps evaluate the injury risk of occupants who aren't exactly the same size or sitting in exactly the same positions as the dummies.
Understanding the ratings: How much better are vehicles that earn good ratings?
In the real world, a driver of a vehicle rated good in the original test is 70% less likely to die in a left-side crash, compared with a driver of a vehicle rated poor. A driver of a vehicle rated acceptable is 64% less likely to die, and a driver of a vehicle rated marginal is 49% less likely to die.
Those numbers come from an analysis of a decade's worth of crash data vehicles rated in the our original side test.
Unlike frontal crash test ratings, side ratings can be compared across vehicle type and weight categories. This is because the kinetic energy involved in the side test depends on the weight and speed of the moving barrier, which are the same in every test. In contrast, the kinetic energy involved in the frontal crash test depends on the speed and weight of the test vehicle.
Tests drive progress
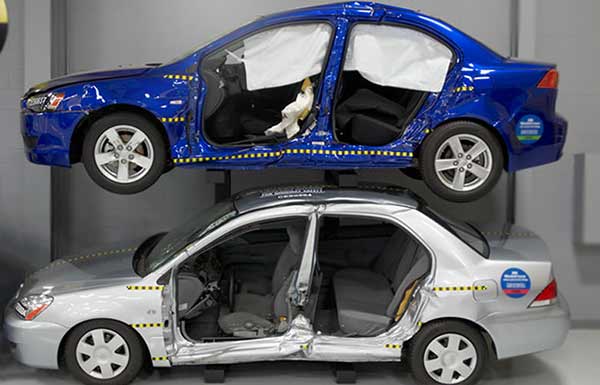
GOOD (original test): 2008 Mitsubishi Lancer with side airbags (top)
POOR (original test): 2005 Mitsubishi Lancer without side airbags (bottom)
When we began side testing in 2003, only about 1 of 5 vehicles tested earned good ratings. Nearly all the others were rated poor.
Since then, airbags have become standard equipment in the vast majority of passenger vehicles, and occupant compartments have become much stronger. These changes are in large part a direct result of the Institute's testing program. Manufacturers know consumers consult the ratings before buying, so they design vehicles with our tests in mind. As a result, nearly all current vehicle designs earn good ratings in the original side test.
Despite this progress, thousands of people are still killed every year in side crashes in the U.S. Most of the side crashes in which people are killed in good-rated vehicles are more severe than the original IIHS side test. Our updated test is expected to help manufacturers identify ways to further enhance side protection.
How do the Institute's side crash tests differ from NHTSA's side tests?
Since our side crash program was launched, NHTSA has made changes to its New Car Assessment Program. It continues to conduct its original side crash test representing a T-bone crash and using a moving barrier. In 2010, NHTSA added a side pole test to address side crashes in which vehicles slide into fixed objects. Unlike NHTSA's moving-barrier test, the pole test requires protection for the driver's head. Both NHTSA tests evaluate vehicle performance solely on measures from the dummies' sensors.
Both the original and updated IIHS side tests typically cause more damage than either of the NHTSA tests. We directly evaluate structural deformation in addition to the measures from dummy sensors. We also review test video to check that structures and airbags work well together to protect occupants.
In the NHTSA moving barrier crash test, the barrier, which resembles the front of a car from the 1970s, strikes the side of the test vehicle at 39 mph and an angle of 27 degrees. Although the test speed is higher than the IIHS test, the lower barrier shape pushes against the strong lower portion of the door frame that is often missed in real crashes. This makes it easier for a vehicle's structure to protect occupants than in the Institute’s test, in which the SUV-like barrier misses that structure except in the case of taller vehicles.
In NHTSA's pole test, the test vehicle slides sideways at 20 mph and a 75-degree angle into a 10-inch-diameter rigid pole. A SID-IIs dummy is in the driver seat, but rear seat head protection is not tested. In contrast, our single, moving-barrier test encourages good head protection for both front- and rear-seat occupants.
Roof strength test 2009-2022
Deaths in rollovers have declined dramatically in recent decades. A major reason is electronic stability control, which helps prevent many rollover crashes, particularly single-vehicle ones, from occurring in the first place. Roofs designed to perform well in the IIHS roof strength test, conducted from 2009 to 2022, have also helped mitigate rollovers when they do occur.
We discontinued the roof strength test because virtually all vehicles were earning good ratings, and an updated federal standard phased in between 2013 and 2017 was similar to our requirements for a good rating.
Why does roof strength matter? When vehicles roll, seat belts and side curtain airbags help protect the people inside. However, for these safety technologies to be most effective, the roof must be able to maintain the occupant survival space when it hits the ground during a rollover. Stronger roofs crush less, reducing the risk that people will be injured by contact with the roof itself. Stronger roofs also can prevent occupants, especially those who aren't using safety belts, from being ejected through windows, windshields or doors that have broken or opened because the roof has deformed.
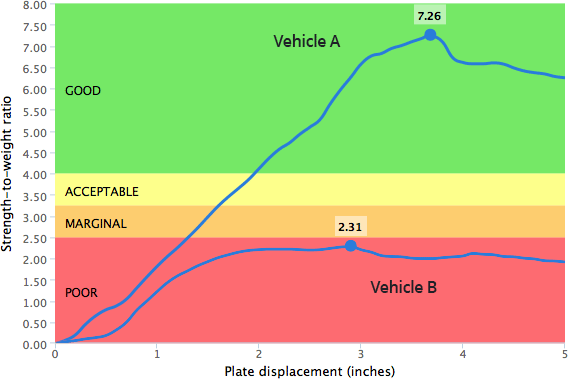
In our test, the strength of the roof was determined by pushing an angled metal plate down on one side of the roof at a slow but constant speed and measuring the force required to crush the roof. The force applied relative to the vehicle's weight is known as the strength-to-weight ratio. The peak strength-to-weight ratio recorded at any time before the roof is crushed 5 inches is the key measurement of roof strength.
A good rating required a strength-to-weight ratio of at least 4. In other words, the roof had to withstand a force of at least 4 times the vehicle's weight before the plate crushed the roof by 5 inches. For an acceptable rating, the minimum required strength-to-weight ratio was 3.25. For a marginal rating, it was 2.5. Anything lower than that was poor.
The figure below shows sample results for two vehicles — one rated good and one rated poor. Peak force for Vehicle A is 7.26. Since that number is higher than 4, the vehicle is rated good. Peak force for Vehicle B is 2.31. Since that number is lower than 2.5, the vehicle is rated poor.
The following video shows how the roof strength test was conducted. In this test of the 2010 Buick LaCrosse, the peak force is 19,571 pounds for a strength-to-weight ratio of 4.90 and a good rating. The playback speed of this video has been increased. The plate normally crushes at a rate of about 1/8 inch per second.
In every test, the roof was crushed 5 inches. What varied — and can't be seen in a video — is the force used by the machine to achieve that degree of crush. To demonstrate how roof strength can vary and what those differences mean for people inside a vehicle during a rollover, IIHS conducted a demonstration in which two vehicles with different roof strength ratings were subjected to identical force. This video shows what happened when the 2009 Volkswagen Tiguan, rated good for roof strength, and the 2008 Kia Sportage, rated poor, were each subjected to a crush force of 15,000 pounds.
Head restraints & seats test 1995-2022
Neck sprains and strains are the most frequently reported injuries in U.S. auto insurance claims. Such whiplash injuries can be sustained in any type of crash but occur most often in rear-end collisions. Good head restraints can help prevent them.
IIHS began evaluating head restraint geometry in 1995 and conducted dynamic tests of vehicle front seats and head restraints from 2004 to 2022. The dynamic test, a simulated rear impact incorporating a special dummy with a realistic spine, helped encourage better head restraint designs. It was discontinued after almost all models began earning good ratings. IIHS researchers are exploring how that test might be updated to help drive further improvements.
Head restraint geometry
Good geometry is essential for an effective head restraint. If a head restraint isn't behind and close to the back of an occupant's head, it can't prevent whiplash in a rear-end collision. A restraint should be at least as high as the head's center of gravity, or about 3.5 inches below the top of the head. The backset, or distance behind the head, should be as small as possible. Backsets of more than about 4 inches have been associated with increased symptoms of neck injury in crashes.
For our ratings, we evaluated the geometry of head restraints in passenger vehicles based on the height and backset relative to an average-size male. The restraints were measured with the angle of the torso at about 25 degrees, a typical seatback angle. We then classified each restraint according to its height and backset into one of four geometric zones — good, acceptable, marginal or poor.
In 1995, only 3% of measured head restraints received good geometric ratings, while 82% were rated poor. Later, most head restraints had good geometric ratings, and the rest were acceptable. IIHS ratings forced manufacturers to pay attention to head restraint design. More recently, a government standard in effect since September 2010 requires a minimum of 29.5 inches from an occupant's hip to the top of a head restraint and a backset of 2.2. inches or less. This guaranteed that nearly all new head restraints would be rated good for geometry by IIHS.
Dynamic ratings
Beginning in 2004, seats and head restraints with geometry rated good or acceptable were tested in a simulated rear impact conducted on a sled. The test assessed how well the seats support the torso, neck and head of a BioRID dummy. It simulated a rear-end crash with a velocity change of 10 mph, approximately equivalent to a stationary vehicle being struck at 20 mph by a vehicle of the same weight.
Two sets of criteria were used for evaluating performance. The first criteria were the two seat design parameters, time to head restraint contact (must be ≤70 milliseconds to pass) and torso acceleration (must be ≤9.5 g to pass). The second set of evaluation criteria were comprised of the maximum neck shear force and maximum neck tension measured on the dummy during the test. These neck forces (classified as low, moderate or high) indicated how well or how poorly an occupant's head and neck would be supported in a rear impact at low to moderate speed. A seat that passes at least one of the seat design parameters and has low neck forces earns a dynamic rating of good.
Dynamic ratings derived from seat parameter and neck force results
Seat parameters
+
Neck forces
=
Dynamic ratings
Pass
+
Low
=
G
Moderate
A
High
M
Fail
+
Low
=
A
Moderate
M
High
P
Overall ratings
The geometric rating and the dynamic rating were combined to produce an overall evaluation of each seat/head restraint combination. A good rating could only be earned with both a good geometric rating and a good dynamic rating. Seats with only acceptable geometry earned an acceptable overall rating even if their ratings in the dynamic test were good. Seats rated marginal or poor for geometry would not be tested dynamically and automatically would be assigned a rating of poor; however, since the 2011 model year, all seats had good or acceptable geometry.
Overall ratings derived from both geometric and dynamic ratings
Geometric rating
+
Dynamic rating
=
Overall rating
G
+
G
=
G
A
A
M
M
P
P
A
+
G
=
A
A
A
M
M
P
P
M
+
No dynamic test
=
P
P
+
No dynamic test
=
P
The IIHS rating applied only to the specific seat/head restraint combination tested, though many vehicles have multiple options for these components. For a given vehicle, the Institute typically tested the seat option most likely to be found on dealer lots.
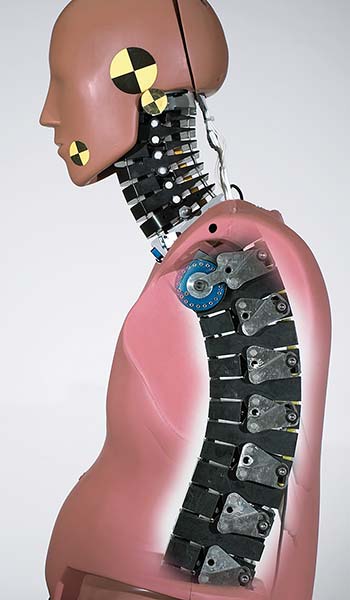
Dummy and sled used in dynamic tests
Dynamic testing of seats/head restraints required a dummy with a realistic spine and neck. Before the development of BioRID, or biofidelic rear impact dummy, all dummies had rigid spines and necks that didn't interact with vehicle seats the way human spines and necks do. BioRID was developed for rear testing by a consortium of Chalmers University, restraint maker Autoliv, Saab and Volvo. This dummy, representing an average-size man, has a spine composed of 24 articulated vertebra-like pieces. The spine interacts with vehicle seats during tests in much the same way as a human spine would. Plus BioRID's segmented neck can produce the motion observed by human necks in real-world crashes in which vehicles are struck from behind.
BioRID 50th percentile male rear-impact dummy
The device on which dynamic tests of seats/head restraints were conducted is a steel flatbed sled that runs on fixed rails. The sled is moved to simulate vehicle crash accelerations, re-creating the forces on occupants inside vehicles during real-world crashes. The changing acceleration or deceleration over the duration of a crash is referred to as a crash pulse, and the key aspect of a sled is that it can be programmed to produce specific crash pulses. To evaluate rear crash protection, vehicle seats were affixed to the sled, which is accelerated to simulate a stationary vehicle that's rear-ended by another vehicle of the same weight going 20 mph. To accomplish this, compressed air is pumped into a special cylinder, thrusting a ram forward in a preprogrammed pattern of acceleration (crash pulse). Peak acceleration in the sled test is 10 g (5 g mean acceleration), and the duration is 91 milliseconds.
Understanding the ratings: How much better are vehicles with good head restraints?
Vehicles with good rear crash ratings do a better job of preventing neck injuries in the real world. In 1999, IIHS researchers analyzed more than 5,000 insurance claims and determined that drivers with head restraints with good geometric ratings were 24% less likely than drivers with poor-rated head restraints to sustain neck injuries in rear-end crashes.
A 2008 study looked at real-world crashes involving seat/head restraint combinations that had been dynamically tested. Insurance claims for drivers of cars and SUVs struck from behind were examined for evidence of driver neck injury. Injury rates were 15% lower for vehicles with seats/head restraints rated good compared with vehicles with seats/head restraints rated poor. Long-term injuries, or those lasting three months or more, were 35% lower for vehicles with seats/restraints rated good compared with seats/restraints rated poor.
Headlight evaluation 2016-present
About half of all fatal crashes in the U.S. occur in the dark, and more than a quarter occur on unlit roads. Headlights have an obvious role to play in preventing nighttime crashes, but not all headlights perform their job equally. Differences in bulb type, headlight technology and even something as basic as how the lights are aimed all affect the amount of useful light supplied.
Headlight technology has been developing rapidly in recent years. LED and high-intensity discharge (HID) lamps have begun to replace the traditional halogen ones. Many automakers offer curve-adaptive headlights, which respond to steering and swivel according to the direction of travel. Many also offer high-beam assist, a feature that can increase the use of high beams by automatically switching between high beams and low beams based on the presence of other vehicles.
At the same time, government regulations about headlights don’t guarantee consistency when it comes to the amount of illumination they provide in actual on-road use. This has resulted in large variation in headlight performance. Many vehicles sold today have inadequate headlights, despite the recent strides in lighting technology.
How headlights are tested
IIHS engineers measure the reach of a vehicle’s headlights as the vehicle travels straight and on curves. Sensors on the track measure how far from the vehicle the light extends with an intensity of at least 5 lux. A lux is a unit of illuminance, or the amount of light falling on a surface. For comparison, a full moon on a cloudless night illuminates the ground below to about 1 lux.
Both low beams and high beams are measured on five approaches, shown in the graphic below:
Straightaway
Gradual left curve (800-foot radius)
Gradual right curve (800-foot radius)
Sharp left curve (500-foot radius)
Sharp right curve (500-foot radius)
On each approach, visibility measurements are taken on the right edge of the roadway. On the curves, measurements also are taken on the left edge of the travel lane. On the straightaway, the second measurement is taken at a point corresponding to the left edge of a two-lane road. This allows the engineers to gauge the illumination on both the right and left side of a straightaway, which are typically quite different. With most headlights, there is a steep drop-off in light on the left side of a straight road in order to prevent glare to oncoming vehicles.
Glare for oncoming vehicles is also measured from low beams in each scenario. Engineers record the percentage by which it exceeds a set threshold.
Headlights are tested as received from the dealer. Although many headlight problems could be resolved by adjusting the aim of the lamps, IIHS doesn’t change headlight aim. Few vehicle owners adjust the vertical aim of their headlights, so leaving the aim the way it was set at the factory makes the testing more realistic. Horizontal aim also is important, but in most vehicles it can't be changed after the initial factory setting.
Readings are taken 10 inches from the ground for visibility and 3 feet, 7 inches from the ground for glare.
How ratings are assigned
IIHS engineers compare the results of the testing with a hypothetical ideal headlight system. Using a system of demerits, they apply the visibility and glare measurements to determine the rating.
In this system, the low beams are weighted more heavily than the high beams because they are used more often. The readings on the straightaway are weighted more heavily than those on the curves because crashes are more common on straight sections of road.
A vehicle with no demerits doesn't exceed the glare threshold on any approach and provides illumination to at least 5 lux over the distances shown in the graphic below. Longer visibility distances are required on the straightaway compared with the curves because vehicles tend to travel at higher speeds while going straight. Similarly, greater visibility is required on gradual curves compared with sharp curves.
Vehicles equipped with high-beam assist get their low beam demerits reduced. This credit is given only for approaches on which the high beams provide more visibility than the low beams.
Understanding the ratings: How much better are good headlights?
Vehicles with good-rated headlights have 19% fewer nighttime single-vehicle crashes than vehicles with poor-rated headlights. Acceptable and marginal headlights are associated with reductions of about 15% and 10%. These numbers are based on a 2021 analysis of police-reported crashes.
Front crash prevention tests 2013-present
IIHS launched the front crash prevention rating program in 2013 to help consumers zero in on the most effective systems. We began with ratings of systems that prevent vehicle-to-vehicle, front-to-rear crashes after research by HLDI indicated that forward collision warning and autobrake systems help drivers avoid front-to-rear crashes at both low speeds and moderate speeds.
Subsequent HLDI research revealed a benefit for front crash prevention systems that recognize pedestrians, and in 2019 a separate evaluation was added for systems that prevent vehicle-to-pedestrian crashes.
Later IIHS studies of police-reported crashes have confirmed these benefits. However, a 2022 IIHS study also found that available pedestrian crash prevention systems didn't work well in the dark, prompting the introduction of a nighttime vehicle-to-pedestrian evaluation.
We suspended our original vehicle-to-vehicle evaluation at the end of 2022 because virtually all new vehicles were earning advanced or superior ratings, in large part thanks to a voluntary commitment by automakers that IIHS helped broker. We launched a new, more challenging test in 2024 to address crashes that occur at higher speeds and involve vehicles other than passenger vehicles.
Originally, the scale used for front crash prevention ratings included designations of basic, advanced and superior.
For vehicle-to-pedestrian ratings, scores in multiple tests were at first used to assign separate day and night ratings. Beginning in 2024, we began issuing a single combined rating. We also adopted the good, acceptable, marginal and poor rating designation used for most of our other evaluations for both the vehicle-to-pedestrian and updated vehicle-to-vehicle tests.
How the vehicle-to-vehicle tests work
In the original vehicle-to-vehicle test, ratings were determined by performance in tests at 12 and 25 mph. The availability of forward collision warning was also factored in.
In each track test, a technician drove the vehicle straight toward a stationary target designed to simulate the back of a car.
We awarded points based on how much the systems slowed the vehicle to avoid hitting the target or lessen the severity of the impact in the two tests. In the case of an unavoidable collision, lowering the striking vehicle’s speed reduces the crash energy that vehicle structures and restraint systems have to manage. That reduces the amount of damage to both vehicles involved in the collision and minimizes injuries to people traveling in them.
To earn a point for forward collision warning, the system had to meet NHTSA criteria. That means the system must issue a warning before a specified time in five of seven test trials under three scenarios. The agency identifies vehicles with systems that meet the standard as part of its online ratings.
In the updated test, launched in 2024, trials are run at 31, 37 and 43 mph (50, 60 and 70 kilometers per hour). Multiple trials are conducted with a target representing a passenger car, a target representing a motorcycle and an actual dry van trailer. Tests are run at all three speeds with each vehicle type. The tests using the motorcycle and passenger car target are conducted with the target positioned in the center of the travel lane and offset to the left or right, while the trailer is always positioned in the center of the lane.
The trials using targets test both the forward collision warning and AEB systems. In each test run, an engineer drives the test vehicle toward the target at the selected speed and records when the forward collision warning occurs and how much the AEB system slows the vehicle to prevent or mitigate the impending impact. If the test vehicle fails to achieve a minimum speed reduction in the 31 or 37 mph tests, only the forward collision warning system is evaluated at higher speeds. Similarly, if the minimum speed reduction isn’t reached with the target in the center of the lane, only the warning function is tested in the offset test at the same speed.
In all the test runs using the trailer, only the forward collision warning system is evaluated, and the driver steers out of the lane to avoid a crash.
Points are awarded for warnings that occur at least 2.1 seconds before the projected time of impact and for any speed reductions in the AEB tests. Speed reductions account for two-thirds and warnings account for one-third of the maximum possible score.
How the pedestrian tests work
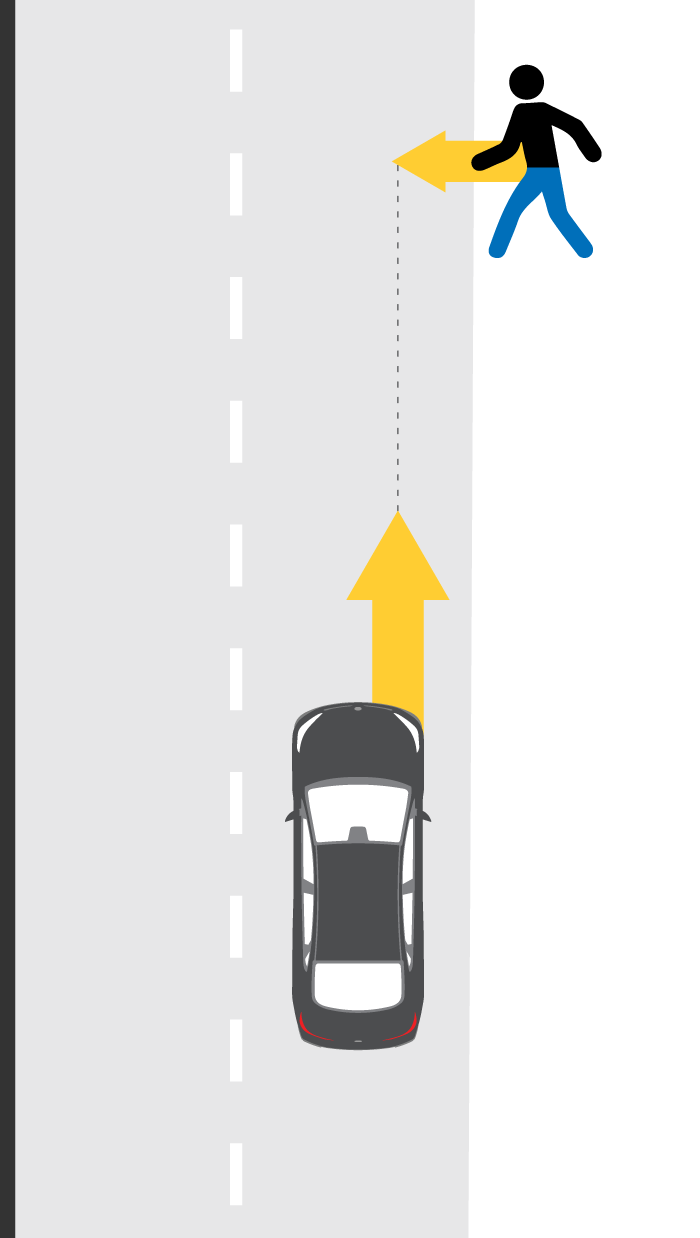
Pedestrian crash prevention capabilities are evaluated using dummies that move across or stand in the roadway. Tests are conducted in the following three scenarios.
Pedestrian test scenarios
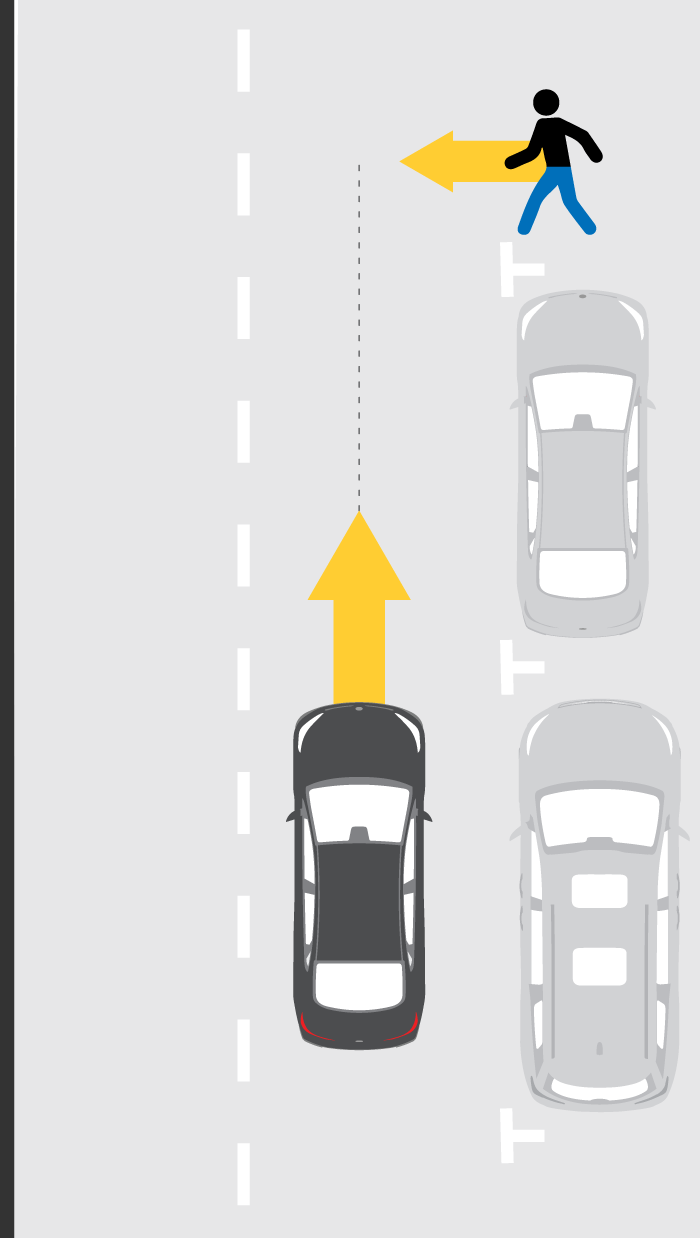
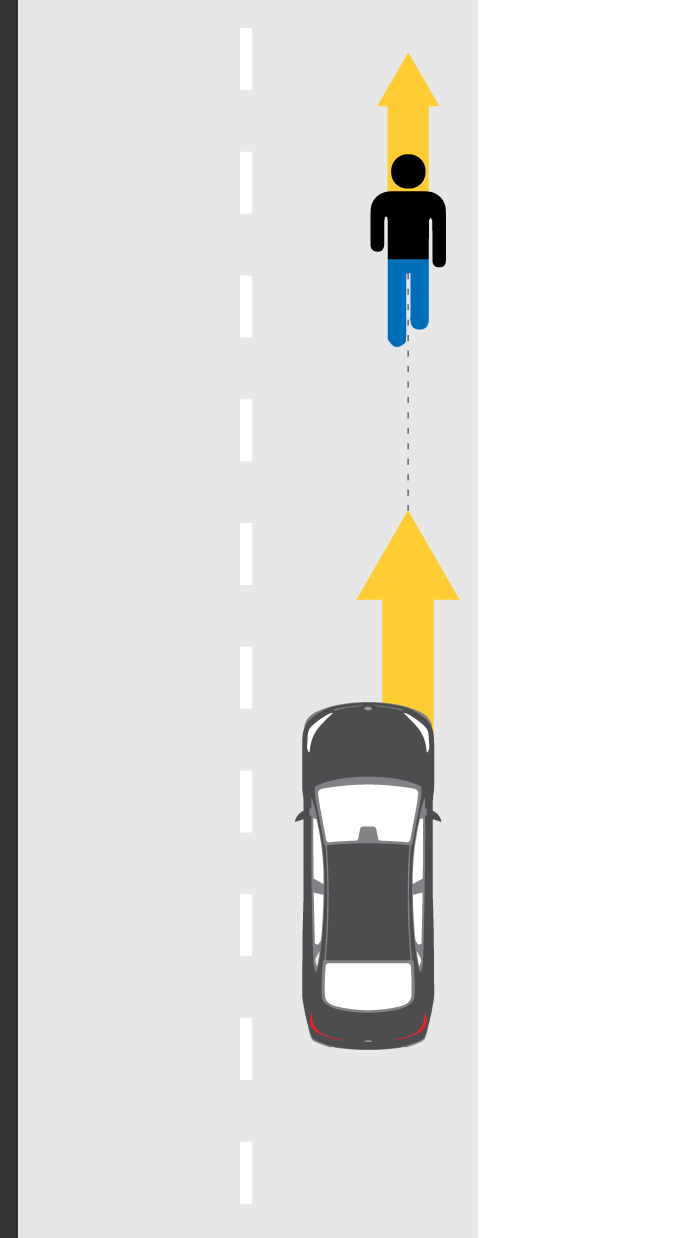
Perpendicular adult: Adult walks across road — tests run at 12 and 25 mph (day and night)
Perpendicular child: Child runs into road; parked vehicles obstruct view — tests run at 12 and 25 mph (day only)
Parallel adult: Adult in right lane near edge of road, facing away from traffic — tests run at 25 and 37 mph (day and night)
We originally used all three scenarios for daytime testing and the the two adult scenarios at night. The combined rating we began publishing in 2024 uses the results of the daytime child scenario and the two adult nighttime scenarios.
As in the vehicle-to-vehicle tests, a GPS system and sensors record data about the vehicle's speed and position, and an on-board camera captures any warnings from the system.
Both the day and night evaluations are conducted on a dry asphalt surface without visible moisture. For the daylight test, ambient illumination must be at least 2,000 lux, such as you might find on an overcast day. For the night test, illumination must remain below 1 lux — about the amount cast by a full moon — throughout the evaluation.
The perpendicular child scenario is not included in the night evaluation because very few child pedestrians are struck at night. Vehicles with radar-only pedestrian detection systems are not tested in the dark, since such systems are not affected by light levels. Instead, the night ratings are calculated using the results from daytime tests.
Seat belt reminder evaluation 2022-present
Lap and shoulder seat belts prevent the driver or passenger from being thrown from the vehicle. They also stop people from colliding with the vehicle interior during a crash and spread crash forces over a larger area of the body to reduce stress on the most fragile parts. For drivers and front-seat passengers, using a lap and shoulder belt reduces the risk of fatal injury by 60% in an SUV, van or pickup and by 45% in a car.
Although most people wear seat belts, the small number who don’t account for an outsized portion of the people killed in crashes. IIHS research shows that many inconsistent belt users simply forget, and better seat belt reminders could make a difference.
Ratings criteria
IIHS evaluates seat belt reminders as good, acceptable, marginal or poor, based on the following characteristics:
Front seating positions
Reminder timing. Visual and audible alerts should signal when a belt in the driver seat or occupied front passenger seat remains unfastened or is unbuckled while the vehicle is traveling 6 mph or faster. These alerts should begin within 30 seconds between 6 mph and 25 mph and within 2 seconds above 25 mph.
Audible signal
Sound level. Audible alerts that are at least 6 decibels louder than the ambient noise in the vehicle cabin at 15 mph and 25 mph are considered loud enough to attract the driver’s attention.
Pitch. The pitch of audible alerts should be within the frequency range of 500 to 2,250 hertz.
Duration. Audible alerts should continue for at least 90 seconds or until the seat belts in all occupied front seating positions are fastened or the vehicle slows to less than 6 mph.
Rear seating positions
Reminder timing. A visual indicator showing each unbuckled second-row seating position should appear within 10 seconds after the driver starts the vehicle. If a second-row seat belt is unbuckled while the vehicle is moving 6 mph or faster, then visual and audible alerts should begin within 30 seconds between 6 mph and 25 mph and within 2 seconds above 25 mph.
Visual indicator location. The visual indicator must appear on the instrument panel, overhead panel or center console.
Signal duration. At start, the visual indicator must remain illuminated for at least 60 seconds or until belts are used at each occupied second-row seating position. If a belt is unbuckled when the vehicle is traveling at least 6 mph, the visual and audible alerts must last at least 30 seconds or until the unbuckled belt is refastened or the vehicle comes to a stop.
Passenger detection is not required for the second row.
How ratings are assigned
To earn a good rating, vehicles must meet all the requirements for both the front and second-row reminders. For an acceptable rating, vehicles must meet the requirements for the front seats only. If the reminder for the front seats falls short of any of the requirements (including duration) but the visual and audible reminder is at least 8 seconds long, the vehicle will be rated marginal. If the driver or front passenger seat reminder is shorter than 8 seconds, the vehicle will be rated poor.
LATCH evaluation 2015-present
Lower Anchors and Tethers for Children (LATCH) is a system of attachment hardware for child restraints. Although child restraints can be installed properly by using vehicle safety belts, LATCH is intended to make correct installation easier. In addition, tether anchors are always needed when installing forward-facing restraints, regardless of whether the lower anchors or the safety belt is used. The top tether keeps the child seat from pitching forward in a crash.
IIHS research has shown that child restraints are more likely to be installed correctly when LATCH is used. However, not all LATCH is easy to use. Parents are more likely to install a restraint correctly when the vehicle hardware meets certain criteria. The Institute established its LATCH rating program in 2015 to encourage manufacturers to design LATCH hardware that meets those ease-of-use criteria.
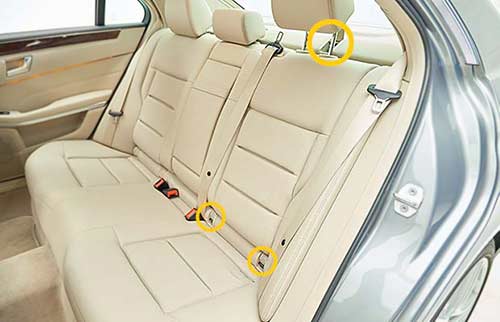
Lower anchor and tether anchor locations in a typical sedan
Ratings criteria
When vehicles are rated for LATCH ease of use, IIHS employees assign each seating position a rating of good, acceptable, marginal or poor. The following characteristics are noted for the lower anchors:
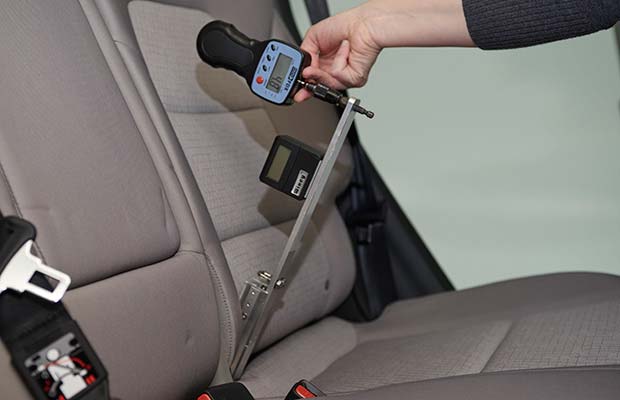
Accessibility of lower anchors. Anchors located at a depth within the seat bight of about ¾ inch or less are considered easy to find. Slightly deeper anchors are OK if they can be easily reached without anything in the way.
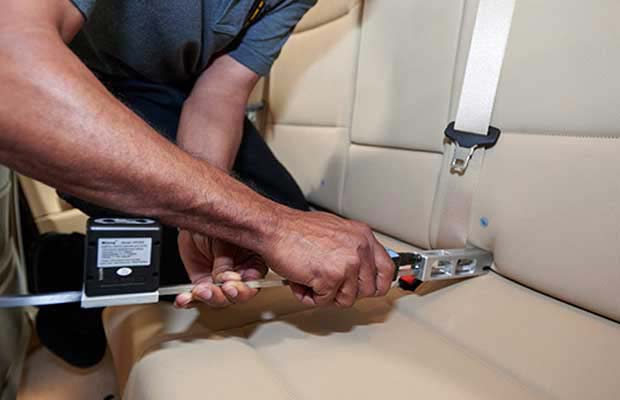
Force. A special tool representing the lower connector of a child seat is used to measure the attachment force required. The force to attach this tool should be under 40 pounds.
Clearance angle. Anything greater than 54 degrees is considered easy to maneuver around.
A special tool is used to measure the force required to attach a connector to the lower anchor (left) as well as to measure the anchor's depth within the seat bight. Another tool measures the anchor's clearance angle (right).
When it comes to the tether anchor, evaluators look at the following things:
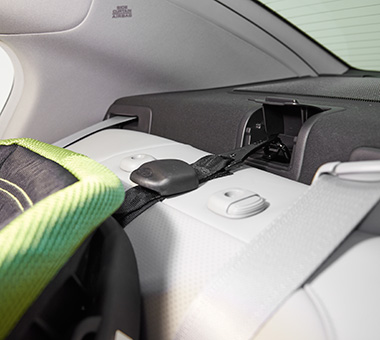
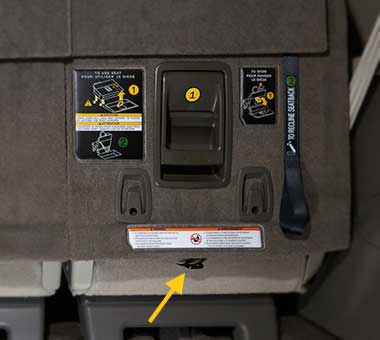
Location. Tether anchors should be on the vehicle's rear deck or on the top 85% of the seatback. They shouldn't be at the very bottom of the seatback, under the seat, on the ceiling or on the floor.
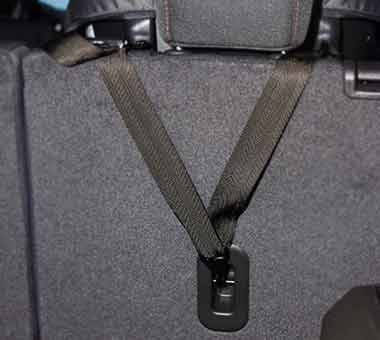
Confusing hardware. The area where the tether anchor is found doesn't have any other hardware that could be confused for the tether anchor. If other hardware is present, then the tether anchor must have a contrasting label located within 3 inches of it.
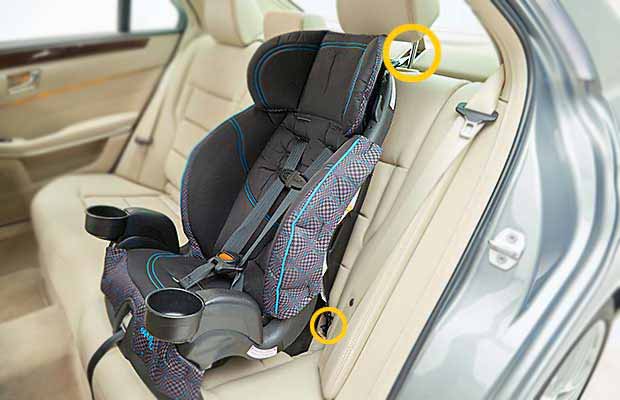
Tether anchors can be found in a variety of locations and sometimes are surrounded by other hardware, making installation confusing.
How ratings are assigned
Under existing federal regulations, most vehicles must have at least two rear seating positions with full LATCH hardware and a third with at least a tether anchor. IIHS ratings are based on the best two LATCH positions available in the vehicle's second row.
To earn a good rating, two LATCH positions must meet all five criteria, and a third tether anchor (if required) also must meet both tether criteria. For an acceptable rating, two LATCH positions must each meet at least 2 of the 3 requirements for lower anchors and at least 1 of the 2 tether anchor requirements. If either position fails to meet the tether anchor requirements or meets only one of the lower anchor requirements, then the vehicle is marginal. If even fewer criteria are met, the vehicle is poor.
A rating of good+ is awarded to vehicles that meet the criteria for a good rating and provide additional LATCH-equipped seating positions for maximum flexibility. For a two-row vehicle, that means having a third good or acceptable LATCH seating position. The third position may use either dedicated anchors or borrowed anchors.
For a three-row vehicle to earn good+, it must have one additional good or acceptable LATCH position (without borrowing) and tether anchors in all rear seating positions. The additional tether anchors must meet at least one of the two tether anchor criteria. If the vehicle has a second-row center seating position, it must have good or acceptable LATCH there (borrowing permitted).
What the ratings mean
The LATCH ratings are an indicator of how easy it is to achieve a correct, tight installation of a child restraint in a given vehicle when using the dedicated child restraint attachment hardware. As long as a restraint is properly installed, the LATCH rating doesn't have any bearing on safety. While it's difficult to achieve a good installation in a poor-rated vehicle, it's generally not impossible. In addition, children are just as safe in restraints that have been properly installed with vehicle belts as in restraints that have been properly installed with LATCH.
Verification
Manufacturers are constantly making changes to their vehicles, but time and budget constraints make it impossible for IIHS to test every model every year. To keep our ratings as comprehensive as possible, IIHS engineers work with manufacturers in a process known as verification.
Every year, we determine whether vehicles are changing in any way that could affect their performance in crash tests — for example, if modifications are being made to the structure or to airbags. Manufacturers provide us this information, and we check it against information from trade journals, auto shows and other sources. If there are no changes, the rating from the previous model gets carried over. If a vehicle has been substantially redesigned, it must be tested again to be included in the ratings.
IIHS doesn’t conduct all the tests for every redesigned vehicle itself. Under certain circumstances, we accept data from verification tests conducted by manufacturers or by third-party testing organizations on their behalf.
We don’t accept verification for headlight evaluations or for the updated moderate overlap test. Verification is accepted for other tests at the discretion of our engineers.
Benefits
Verification allows IIHS to provide consumers with up-to-date information. It ensures that automakers continue to pay attention to all crash modes as they redesign vehicles. At the same time, it frees Institute engineers to conduct research and develop new tests that in the future will lead to even more improvements in crash protection.
How it works
If a vehicle is eligible for verification, and the manufacturer wants it to receive a rating from IIHS, the company must conduct the test according to Institute parameters.
For crash tests, the company provides video footage, along with measurements of intrusion and injury data from the dummies.
For evaluations of vehicle-to-pedestrian front crash prevention, the manufacturer must provide test footage, as well as information about the vehicle’s speed, location and accelerator and brake pedal positions. IIHS engineers analyze this information and assign the rating, just as they would if the test had taken place in the Institute’s own Vehicle Research Center.
To ensure good faith participation, we conduct occasional audit tests in which vehicles are retested in-house to make sure the results don’t differ significantly from the manufacturers’ tests.