Two main factors determine losses under the six insurance coverages defined above. One is how often claims are filed (claim frequency). The other is the size of the claim payments (claim severity), which depends on the extent of the damage. Overall insurance losses, or the average loss payment per insured vehicle year, are calculated by multiplying claim severity by claim frequency. Overall losses represent the average cost of insuring a vehicle for one year, excluding administrative costs.
To make it easier to compare different vehicles, HLDI calculates relative claim frequency, claim severity and overall losses. In each of the charts below, the value 100 corresponds to the average result for all vehicles. For example, in the first chart, the all-vehicle average collision loss of $532 per insured vehicle year has been normalized to 100. A value of 200 for a particular vehicle or vehicle category means twice the average for all vehicles, a value of 50 means half the average, and so forth.
Crash damage by vehicle class and size
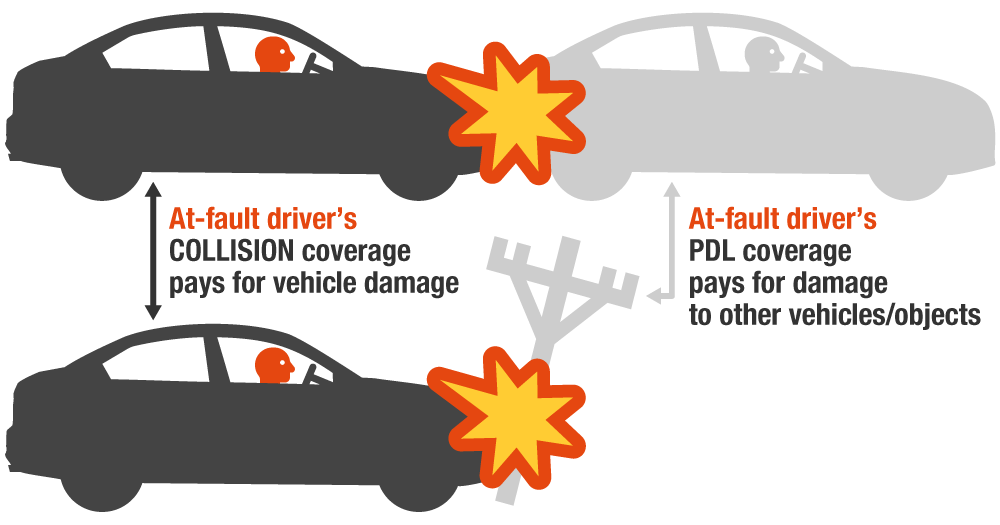
Within each vehicle class (e.g., two-door cars or luxury SUVs), overall losses under both collision and PDL are generally higher for larger vehicles than for smaller ones. For collision, which covers crash damage to the insured vehicle, that’s because larger vehicles tend to be more expensive to buy and more costly to repair or replace. For PDL, which covers crash damage caused by the insured vehicle to other vehicles and property, it’s because larger vehicles are heavier and therefore do more damage to whatever they hit.
Vehicle class also matters. Over the past several years, overall losses under collision and PDL coverages have been especially high for large two-door cars, a category has been made up entirely of variants of the Dodge Challenger. A daily-use vehicle, the Challenger boasts a powerful engine and may appeal to a greater number of fast, aggressive drivers as a result.
Collision claim severity is high among luxury vehicles and sports cars because of their high prices. However, both collision and PDL claim frequencies are lower for these classes than most others. That's because luxury vehicles and sports cars are often owned by households with more vehicles than drivers and therefore aren’t always used every day.
Collision and PDL claim frequencies also tend to be lower for station wagons, minivans and vans than for other vehicle types. Wagons and minivans appeal to less aggressive drivers. The very large vans covered by the HLDI database, which excludes commercial vehicles, may be used on an occasional basis rather than day-to-day.
Some of these trends are noticeable in the chart below, which depicts relative overall losses under collision coverage for 2020-22 models as of December 2023.
Losses under collision coverage by vehicle class and size, 2020-22 models
100 = $532 (all-passenger-vehicle result)
For 2020-22 models, collision overall losses were higher than average for large two-door cars (variants of the Dodge Challenger) because of high claim frequency (HLDI, 2023). Low claim frequency kept losses low for station wagons, minivans and vans, while high claim severity resulted in higher-than-average losses for sports cars and luxury cars.
Injury losses by class and size
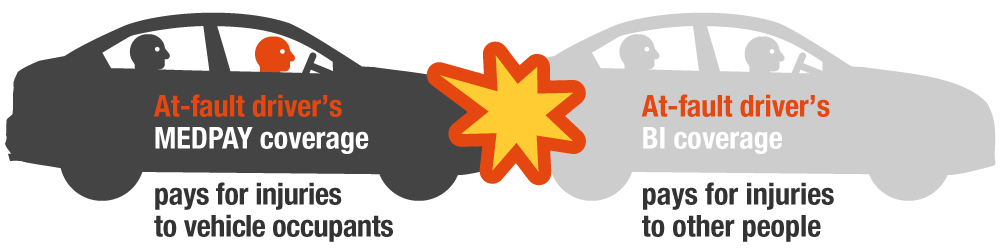
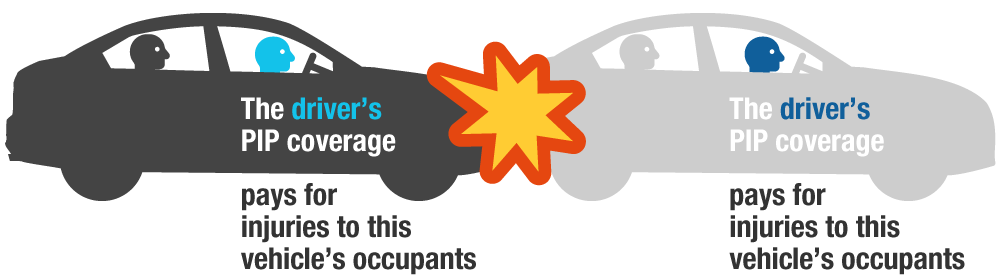
Within each vehicle class, first-party injury (i.e., MedPay and PIP) claim frequency tends to decrease as vehicle size increases. The occupants of larger, heavier vehicles are subjected to less force and benefit from more survival space in the event of a crash. In contrast, the severity, or cost, of injury claims tends to increase with vehicle size. This may be because larger vehicles are more likely to be carrying multiple passengers, increasing the odds of multiple injuries.
Just as in claims for crash damage, vehicle class also makes a difference in injury claims. For instance, relative claim frequencies under MedPay and PIP coverages are generally higher than average for small four-door cars, which don’t provide as much protection in crashes with larger vehicle types. Claim frequencies are generally lower for SUVs and luxury SUVs, which are heavier and therefore offer more protection.
These general trends are reflected in the chart below, which shows relative overall losses under MedPay for 2020-22 models as of December 2023.
Losses under medical payment coverage by vehicle class and size, 2020-22 models
100 = $43 (all-passenger-vehicle result)
Among model year 2020-22 vehicles, MedPay overall losses were highest for very large luxury cars and four-door microcars and lowest for mini sports cars (HLDI, 2023). Losses are generally lower for larger vehicles within each vehicle class. However, large two-door cars and large sports cars have high losses. This is likely due to the high horsepower offered by the larger models in these vehicle classes.
Comprehensive coverage
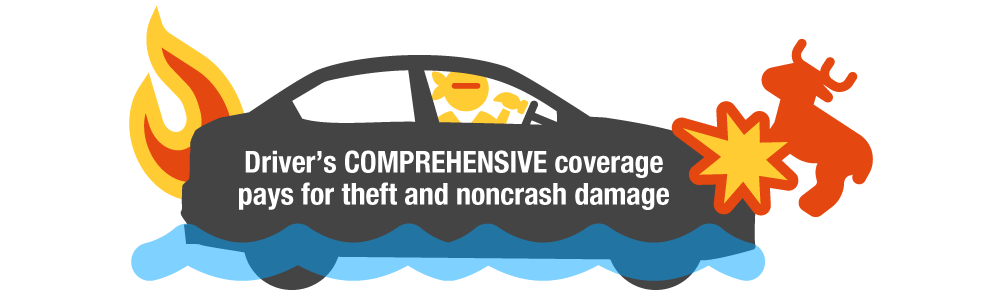
Losses under comprehensive coverage are not generally related to safety. HLDI classifies comprehensive losses into three groups: theft; glass damage caused by rocks and other noncollision events; and damage from other sources, including collisions with animals, acts of nature, fire and vandalism.
Typically, overall losses under comprehensive coverage are highest for very large luxury cars, which are expensive to repair or replace. Within vehicle categories, overall losses tend to increase with vehicle size.
Losses under comprehensive coverage by vehicle class and size, 2020-22 models
100 = $189 (all-passenger-vehicle result)
Among 2020-22 model year vehicles, comprehensive overall losses were highest for very large luxury cars due to their high cost (HLDI, 2023).
Theft overall losses are lowest for cheaper vehicles that are unpopular with thieves, like small station wagons. However, losses from theft, which include entire vehicles, parts and items stored inside the vehicle, can be surprising. Recently, theft losses have soared for Hyundai and Kia models that lack electronic immobilizers, which makes them easy to steal (HLDI, 2023).
Older Toyota Prius models have also been targeted for catalytic converter theft because the catalytic converters command especially high prices from scrap dealers (HLDI, 2022).
Theft overall losses by vehicle class and size, 2020-22 models
100 = $24 (all-passenger-vehicle result)
All sizes of 2020-22 model year station wagons and minivans had lower than average theft overall losses (HLDI, 2023). Large and very large vehicles tended to have much higher than average theft overall losses. Theft overall losses for Dodge Challenger variants (i.e. large two-door cars) were nearly 10 times the all-vehicle average due to high claim frequency for whole-vehicle theft.